
Hello guys, Bushan here welcomes back to B2 Tech. Today in this article will discuss Charts. To draw charts so many libraries, API’s are available but we will be discussing Highcharts in this post and our upcoming posts.
In general,
- A Chart is a graphical representation of data.
- Charts allow users to see what the results of data to better understand and predict current and future data.
- Charts are an excellent way to condense large amounts of information into easy-to-understand formats that highlight the points you’d like to make.
There are many different chart types available, and sometimes the hardest part is deciding which chart type is best for your need. I would like to use Highcharts most of the time because of the following reasons,
- Compatibility: It is compatible with all modern browsers including the iPhone/iPad and Internet Explorer from version 6.
- Pure JavaScript: Highcharts is based on innate browser technologies. It does not depend on any client-side plugins like Java or Flash. There is also no need to install anything on your server. No PHP or ASP.NET. It only requires two JS files to run: The highcharts.js core and each of the jQuery, MooTools or Prototype framework.
- Export and print: After enabling the exporting module, users can export the chart to PDF, SVG, PNG or JPG format or can be printed directly from the web page.
- Free for non-commercial: It is free for a personal website, a school site or a non-profit organization, there is no need for the author’s permission.
- Open: This is the main feature of Highcharts that under any of the licenses, free or not, you are allowed to download the source code and make your edits. Also permits for personal modifications and ample flexibility.
And the list goes on and on… So in this post will discuss Line Chart using Highcharts Library.
Tools and Technologies,
- Java 8
- Spring Boot
- JPA
- jQuery
- Highcharts
- MySQL
- Eclipse Oxygen
- Maven
First, let’s set up the Database
CREATE DATABASE analytics;
Next, select the Database
USE analytics;
Next, create a Table
CREATE TABLE line_chart
(
    id INT NOT NULL PRIMARY KEY AUTO_INCREMENT,
    category VARCHAR(45) NOT NULL,
    series DOUBLE NOT NULL
);
Next, add a few entries to newly created table
INSERT INTO line_chart(category, series) VALUES('Jan', 29.9);
INSERT INTO line_chart(category, series) VALUES('Feb', 71.5);
INSERT INTO line_chart(category, series) VALUES('Mar', 106.4);
INSERT INTO line_chart(category, series) VALUES('Apr', 129.2);
INSERT INTO line_chart(category, series) VALUES('May', 144.0);
INSERT INTO line_chart(category, series) VALUES('Jun', 176.0);
INSERT INTO line_chart(category, series) VALUES('Jul', 135.6);
INSERT INTO line_chart(category, series) VALUES('Aug', 148.5);
INSERT INTO line_chart(category, series) VALUES('Sep', 216.4);
INSERT INTO line_chart(category, series) VALUES('Oct', 194.4);
INSERT INTO line_chart(category, series) VALUES('Nov', 95.6);
INSERT INTO line_chart(category, series) VALUES('Dec', 54.4);
Next, create a Spring boot project in https://start.spring.io and import to Eclipse IDE,

Make sure to download the Highcharts and Jquery library from the respective websites and add it to the resources folder or you can use the CDN link directly,
Highcharts – Click here
jQuery – Click here
Now let’s start with application.properties
application.properties
spring.mvc.view.prefix= /WEB-INF/jsp/
spring.mvc.view.suffix= .jsp

spring.datasource.url=jdbc:mysql://localhost:3306/analytics
spring.datasource.username=root
spring.datasource.password=
Next, create a Model class
Data.java
package in.bushansirgur.highcharts.model;

import javax.persistence.Column;
import javax.persistence.Entity;
import javax.persistence.GeneratedValue;
import javax.persistence.GenerationType;
import javax.persistence.Id;
import javax.persistence.Table;

@Entity
@Table(name = "line_chart")
public class Data {

	@Id
	@GeneratedValue(strategy=GenerationType.IDENTITY)
	@Column
	private Integer id;
	@Column
	private String category;
	@Column
	private Double series;
	public Integer getId() {
		return id;
	}
	public void setId(Integer id) {
		this.id = id;
	}
	public String getCategory() {
		return category;
	}
	public void setCategory(String category) {
		this.category = category;
	}
	public Double getSeries() {
		return series;
	}
	public void setSeries(Double series) {
		this.series = series;
	}
	@Override
	public String toString() {
		return "Data [id=" + id + ", category=" + category + ", series="
				+ series + "]";
	}
}
Next, create DAO class to access the database records,
DataDAO.java
package in.bushansirgur.highcharts.dao;

import in.bushansirgur.highcharts.model.Data;

import org.springframework.data.jpa.repository.JpaRepository;
import org.springframework.stereotype.Repository;

@Repository
public interface DataDAO extends JpaRepository<Data, Integer>{

}
Next, create a Controller class
HomeController.java
package in.bushansirgur.highcharts.controller;

import in.bushansirgur.highcharts.dao.DataDAO;
import in.bushansirgur.highcharts.model.Data;

import java.util.List;

import org.springframework.beans.factory.annotation.Autowired;
import org.springframework.stereotype.Controller;
import org.springframework.web.bind.annotation.RequestMapping;
import org.springframework.web.bind.annotation.ResponseBody;

import com.google.gson.JsonArray;
import com.google.gson.JsonObject;

@Controller
public class HomeController {

	@Autowired
	DataDAO dataDAO;

	@RequestMapping("/")
	public String showHome(){
		return "index";
	}

	@RequestMapping("/linechartdata")
	@ResponseBody
	public String getDataFromDB(){
		List<Data> dataList = dataDAO.findAll();
		JsonArray jsonArrayCategory = new JsonArray();
		JsonArray jsonArraySeries = new JsonArray();
		JsonObject jsonObject = new JsonObject();
		dataList.forEach(data->{
			jsonArrayCategory.add(data.getCategory());
			jsonArraySeries.add(data.getSeries());
		});
		jsonObject.add("categories", jsonArrayCategory);
		jsonObject.add("series", jsonArraySeries);
		return jsonObject.toString();
	}
}
And here the main Class
HighchartsApplication.java
package in.bushansirgur.highcharts;

import org.springframework.boot.SpringApplication;
import org.springframework.boot.autoconfigure.SpringBootApplication;

@SpringBootApplication
public class HighchartsApplication {

	public static void main(String[] args) {
		SpringApplication.run(HighchartsApplication.class, args);
	}

}
Next, create a JSP to display the chart
index.jsp
<%@ page language="java" contentType="text/html; charset=ISO-8859-1"
pageEncoding="ISO-8859-1"%>
<!DOCTYPE html PUBLIC "-//W3C//DTD HTML 4.01 Transitional//EN" "http://www.w3.org/TR/html4/loose.dtd">
<html>
<head>
<meta http-equiv="Content-Type" content="text/html; charset=ISO-8859-1">
<title>Insert title here</title>
</head>
<body>
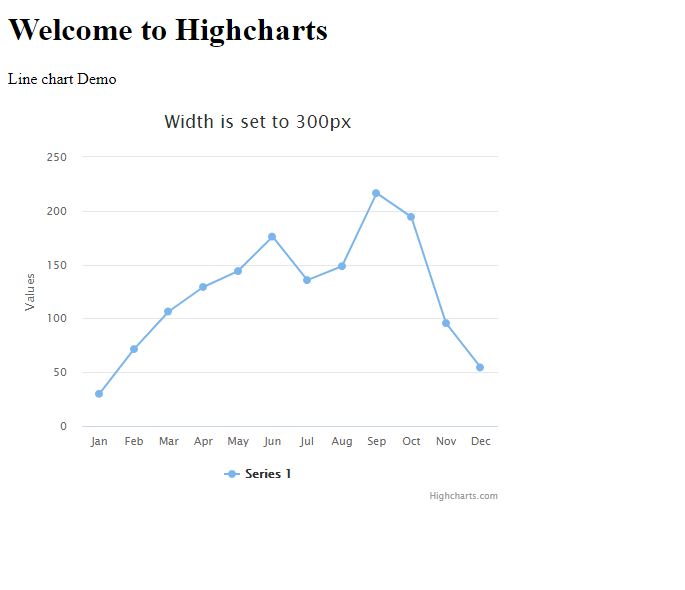
<h1>Welcome to Highcharts</h1>
<p>Line chart Demo</p>
<div id="container" style="height: 400px"></div>
<script src="js/highcharts.js"></script>
<script src="js/jquery.js"></script>
<script src="js/index.js"></script>
</body>
</html>
Next, create a JS script file for the chart
index.js
$.ajax({
	url: "linechartdata",
	success: function(result){
		var category = JSON.parse(result).categories;
		var series = JSON.parse(result).series;
		drawLineChart(category, series);
	}
});

function drawLineChart(category, series){
	Highcharts.chart('container', {
	    chart: {
	        type: 'line',
	        width: 500
	    },

	    title: {
	        text: 'Width is set to 300px'
	    },

	    xAxis: {
	        categories: category
	    },

	    tooltip: {
	        formatter: function() {
	          return '<strong>'+this.x+': </strong>'+ this.y;
	        }
	    },

	    series: [{
	        data: series
	    }]
	});
}
When you run the application, the chart looks like this
That’s it for this post, I hope this post is helped you in some way or the other way if it did then please let me know in the comments section and as always share this post in all the social media platforms.
Thanks and Regards,
Bushan Sirgur